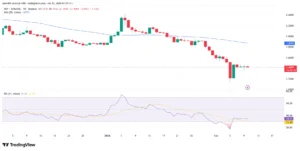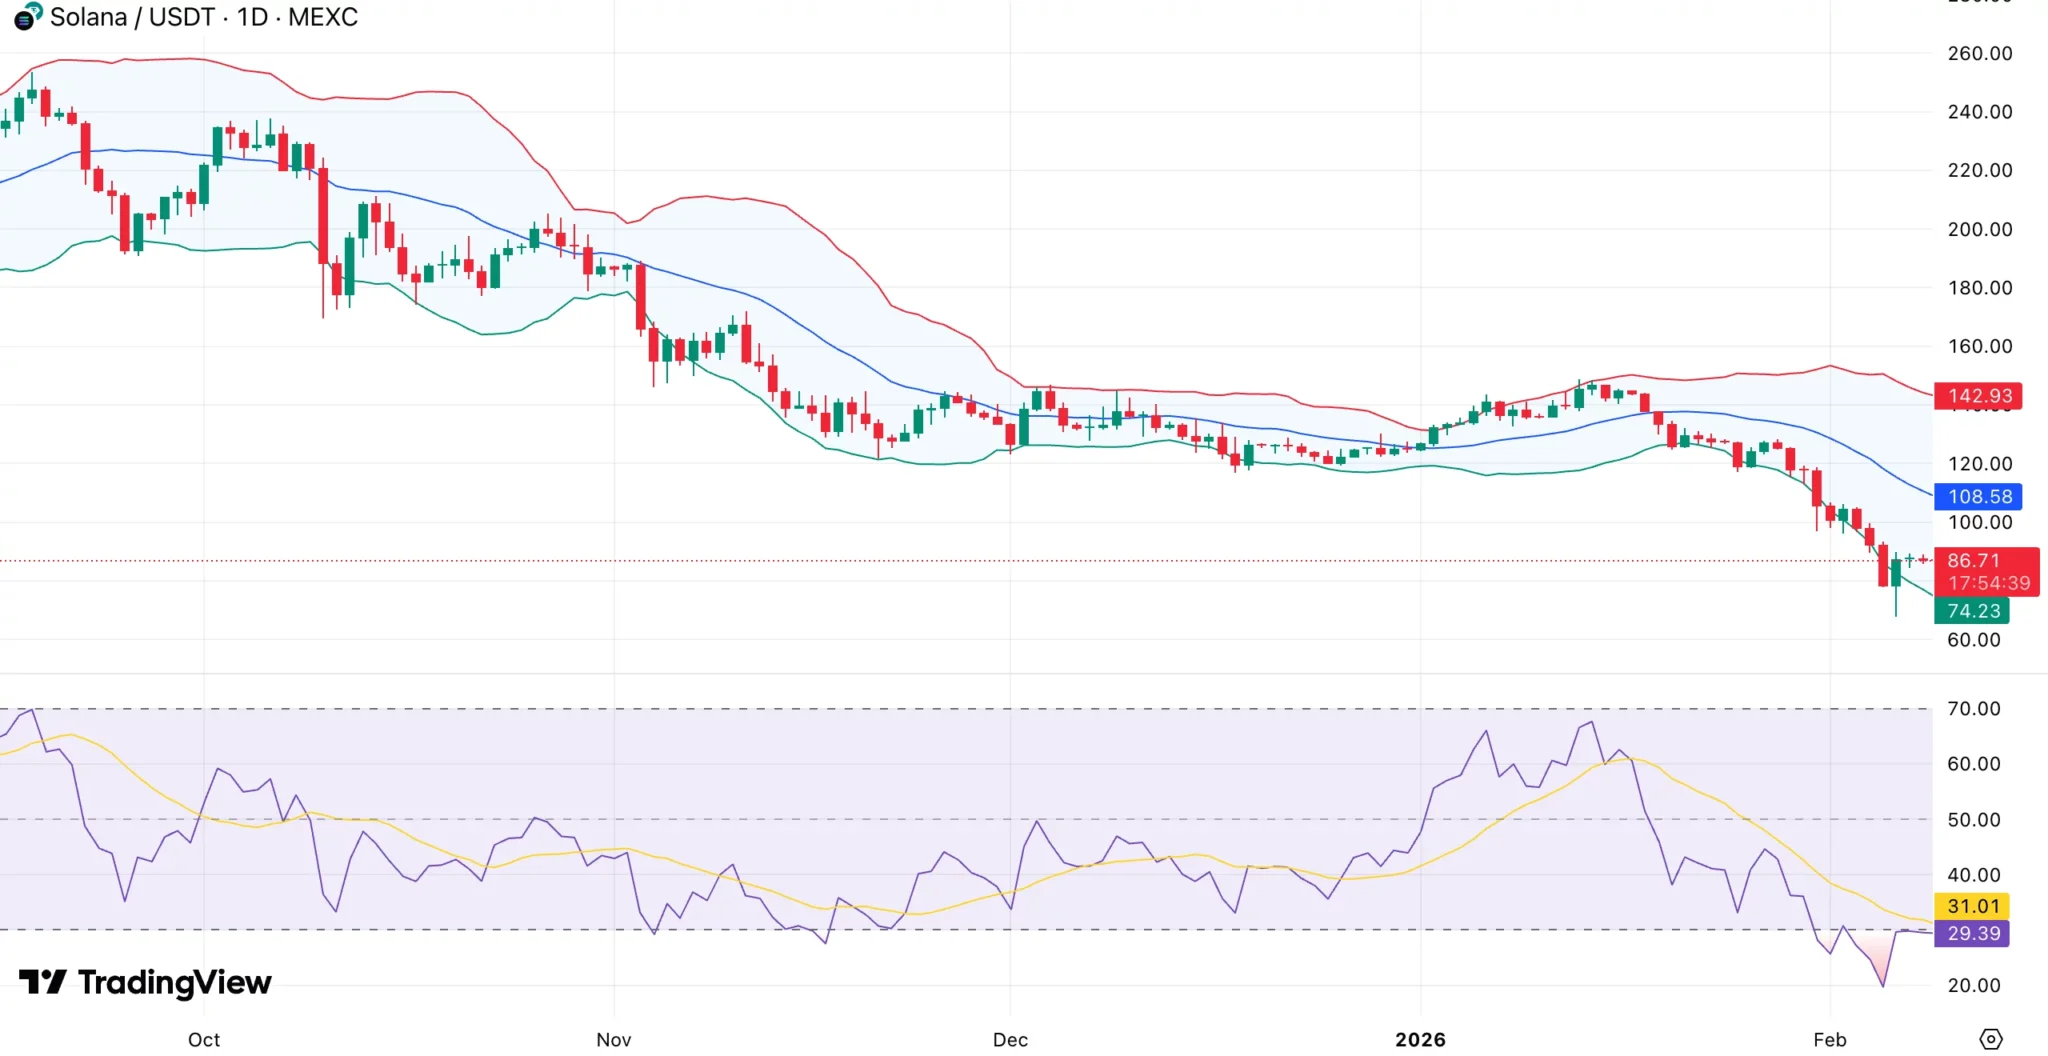
On the chart, Solana continues to trade within a clearly defined bearish structure. Price was rejected near the Bollinger mid-band around $108, and the sequence of lower highs remains intact.
SOL is trading below both the 50-day and 100-day moving averages, which continue to slope downward. The $95–$100area has flipped into overhead supply after repeated failures, limiting recovery attempts.
Instead of a steady base, daily candles have remained near the lower Bollinger Band, indicating ongoing selling pressure.
Momentum indicators are still weak. The daily relative strength index is oversold but lacks a bullish divergence, sitting near 30. Prior dips to comparable RSI levels have produced brief recoveries, but buyers have struggled to sustain follow-through.
The $85 region is serving as short-term support and is in line with a previous demand pocket. A daily close below this level would expose the $80–$75 area next.
To ease downside pressure, Solana would need to reclaim the mid-band and hold above $100, supported by stronger volume, something the market has yet to deliver.
Bithumb says 99.7% of mistaken BTC has been recovered
In a notice published on its website, Bithumb said the incident stemmed from an internal mistake during a reward event on Feb. 6, when users were meant to receive small incentives denominated in Korean won. Due to a system configuration error, Bitcoin (BTC) was credited instead, prompting some recipients to immediately sell the assets.